
Effective tax rates over the years
One of my pet peeves is how people get all obsessed with marginal tax rates when no one actually pays them. For more-or-less random reasons, I decided to look at effective rates over the years. After all, what with all the yelling and screaming about taxes over the past thirty years, you’d think they’ve been wildly gyrating. Not so:
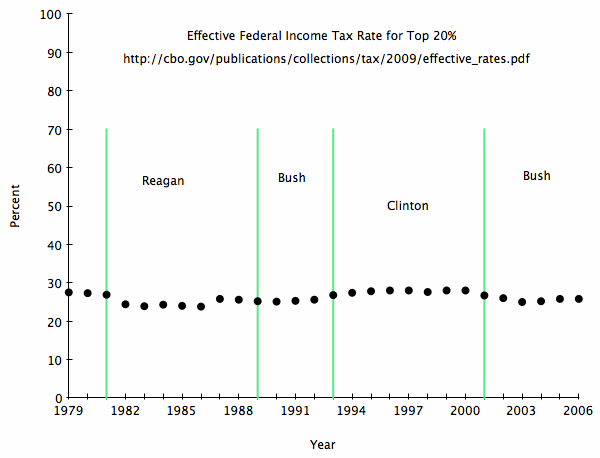
I picked data for the top quintile of people, figuring that you, dear reader, were most likely to fall into that category.
Now, changes in tax rates aren’t the only way people’s incomes change. So I decided to plot three lines:
-
The after-tax income of the prototypical top-quintiler.
-
The after-tax income assuming that, starting with 1979, effective tax rates never increased. That is, every decline to a new low was allowed, but not the reverse. So the effective rate remained at its 1986 low of 23.8% until 2003 (the last year for which I could find data).
-
The after-tax income assuming the reverse: that only increases happened. So the rate remained at 27.5% until the 1995 increase to 27.8% and got pegged at 28% the next year.
The result:
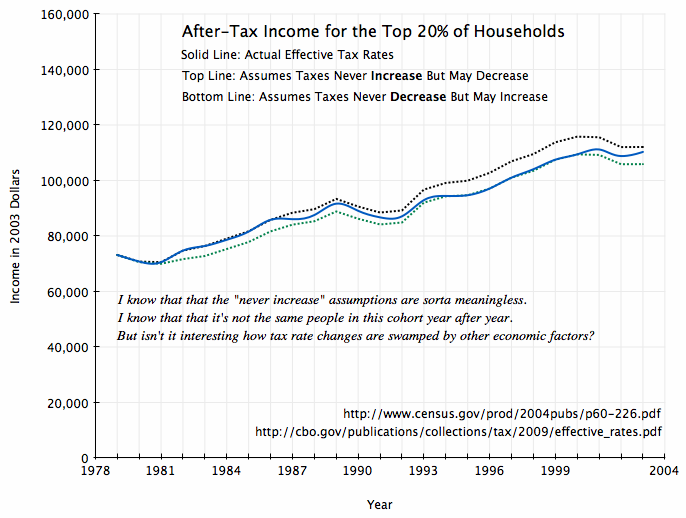
When it comes to taxes, difference between a Reagan and a Clinton is just not that huge. Choosing who to vote for based on tax zealotry is probably silly. Lots of other things the government does has a larger effect on your income and your children’s.
I could be missing something.