Exploration Through Example
Example-driven development, Agile testing, context-driven testing, Agile programming, Ruby, and other things of interest to Brian Marick
| 191.8 | ⇒ | 167.2 | ⇒ | 186.2 | 183.6 | 184.0 | 183.2 | 184.6 |

Exploration Through ExampleExample-driven development, Agile testing, context-driven testing, Agile programming, Ruby, and other things of interest to Brian Marick
|
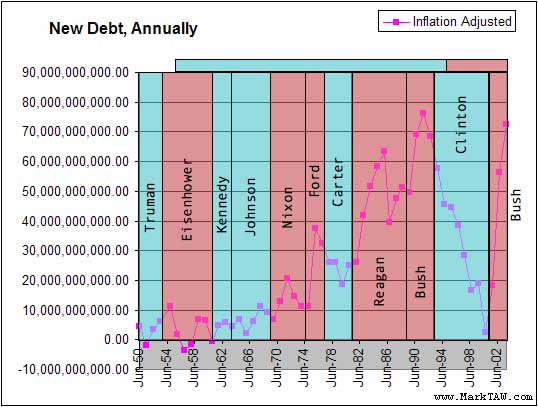
Tue, 11 Jul 2006I stumbled across a bunch of graphs about the US national debt, courtesy Mark Wieczorek. Keeping in mind my suspicion of simplistic use of numbers, one graph is still pretty interesting for someone who grew up, as I did, hearing all about "tax and spend" liberals of the Lyndon Johnson variety. It's below, showing the yearly increase in the debt in constant dollars. I've overlaid color. Republican Presidential administrations are red, Democratic blue. The bars across the top show control or near-control of Congress. 
Note: the vertical lines are approximate. If I were truly serious, I'd make some sort of effort to determine if the lines should be shifted to the right (since Presidents don't have an instantaneous effect). However, I'm mainly doing this because I'm stuck on something I'm supposed to be writing, I need a break, and I'm in a hotel room in Cleveland.
The final picture is my family. The small ones get to pay it off—the "bridge to nowhere", an overpriced prescription drug plan, Paris Hilton's tax break on unearned income, sloppy accounting in Iraq, a culture of corruption that's far beyond what Democrats achieved in their days of power, all of it. That's shameful. I expect my children's generation will look at the adults of today and call us lazy, feckless, self-centered, and stupid. With justice. 
|
|